
Measurement methods · What is vibrating?
Modes, nodes and peak identification
How do we know which vibration a frequency belongs to?
A mode includes a spatial shape as well as a natural frequency and damping. The identification matters because inversion formulas assume a particular family and order of vibration.
Try the interactive demoStart with something familiar
A skipping rope can form one large loop or several smaller loops. These patterns help visualize modes. A vibrating wood strip also has different patterns, although bending beams do not follow the same frequency ratios as a stretched rope.
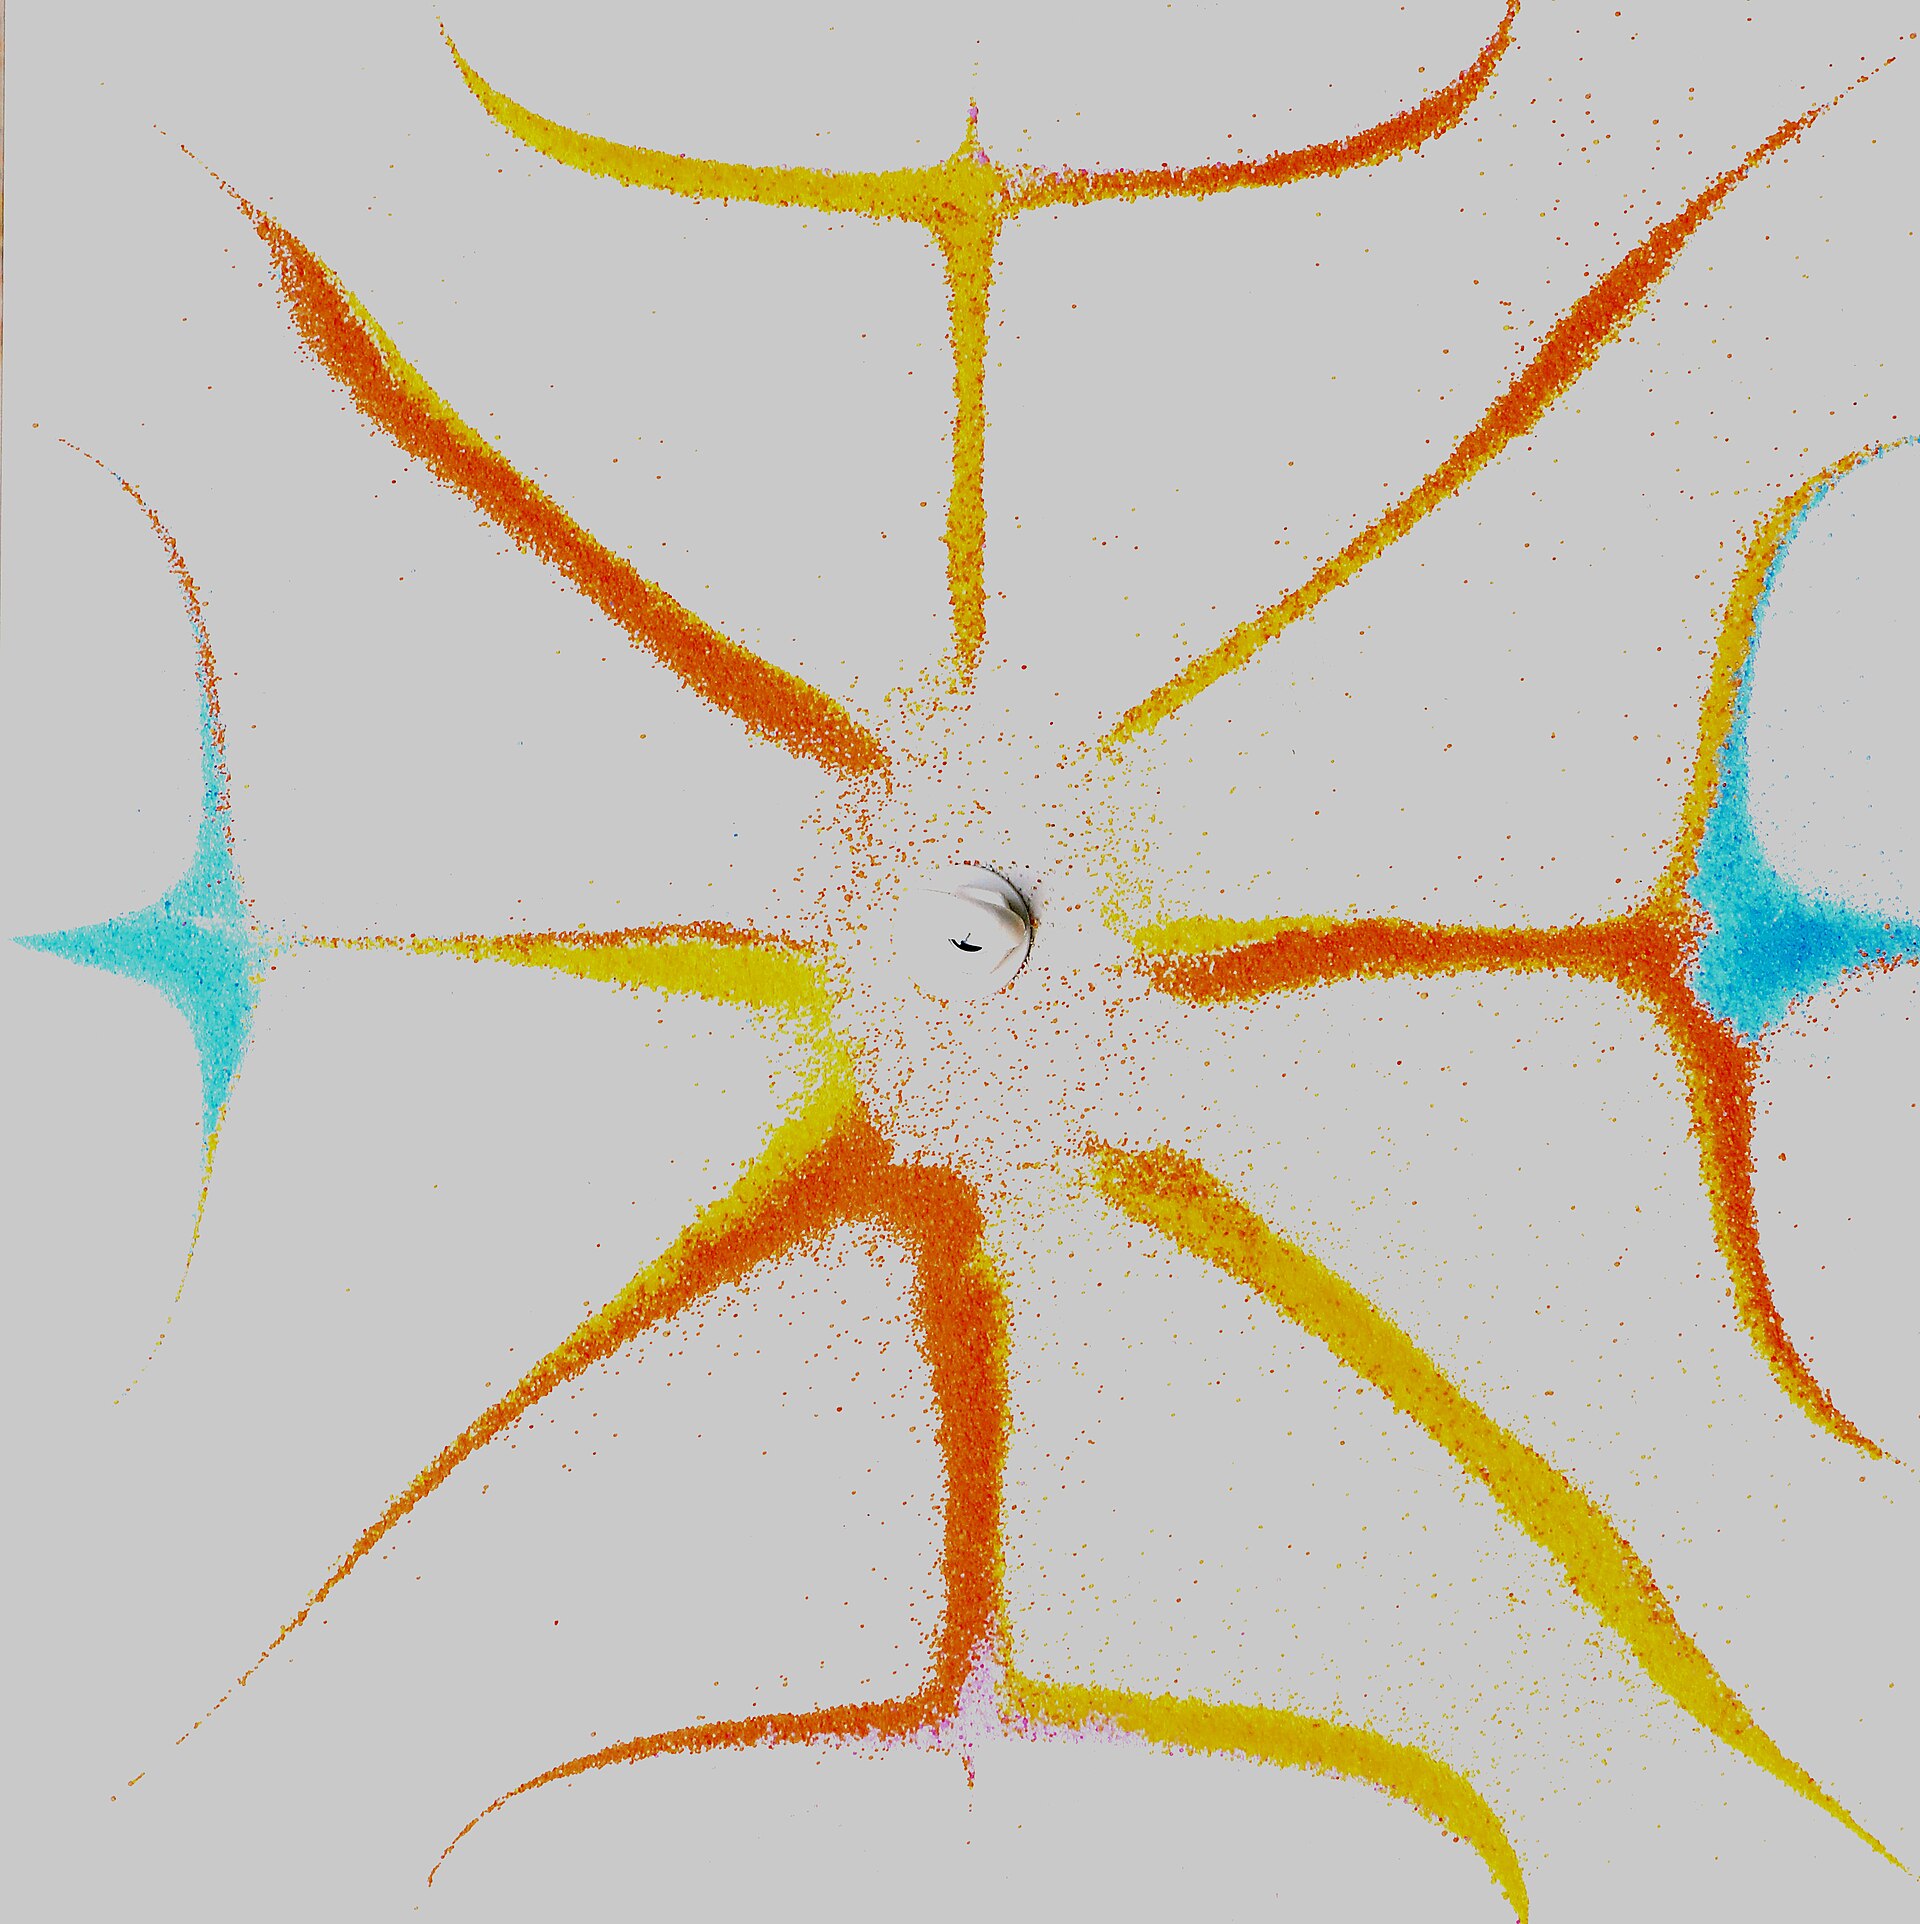
Connect the diagram to a real object
In this real Chladni experiment, colored salt gathers along nodal lines of a vibrating metal plate. The pattern helps make a mode visible; a wooden specimen needs its own mode identification and boundary conditions.
Carlos Andrés Reyes · Wikimedia Commons · CC BY 2.0
Article photographs retain their full proportions; covers show a cropped view.
Bending mode 1
Red dots: displacement nodes
Bending mode 2
Red dots: displacement nodes
Notice what changes
A mode is a spatial pattern, not just a pitch. Some locations move strongly while the displacement nodes scarcely move for that mode.
Understand why
Where you tap matters. A tap at a node gives weak participation of that mode; tapping an antinode can make it easier to excite. This does not remove other modes from the object.
Connect it to wood and making
A modulus formula expects a named mode. Identifying the wrong family or order changes the inference even if the peak frequency itself is read accurately.
Put names to the ideas
Shape, frequency and loss
In a linear modal description, each mode has a characteristic displacement pattern. Two peaks near each other may correspond to different bending directions, torsion or structural coupling.
Nodes are quiet locations
Tapping at a displacement node weakly excites that mode; observing there can also suppress it. Moving the tap or microphone tests whether a peak responds as the assumed shape predicts.
Order is model-specific
A free beam’s rigid translation and rotation are zero-frequency motions, not its first bending resonance. Do not substitute a plate Mode 5 frequency into a first-bending-beam formula.
φn describes the shape of mode n; qn describes how strongly that shape moves over time. The sum means several patterns can be present in one recording.
A worked example
For the same ideal uniform beam, rotating the bending direction exchanges the relevant width and thickness. A second strong peak can therefore be another bending family rather than a harmonic.
Explore it yourself
Repeat the test at several tap and support positions. Compare the observed response with the boundary-condition explorer before selecting a frequency.
- Relative point-force coupling
- 0.608
- Selected position
- 50.00 % L